
After collecting some simple information on a 100 different graphics students about what hair colour they had i could quickly make a little moch up graph just to give me an idea what the pie chart would look like if i were to construct an more complicated infographics chart.

After collection more detailed research into hair with pantone and colour catogories i started to draw up some ideas for more complicated info graphs this was an initail idea before i went onto work on illustrator/photoshop. I wanted to catogorise each commonly found pantone according to size depending on how frequently it was found in my surveys.
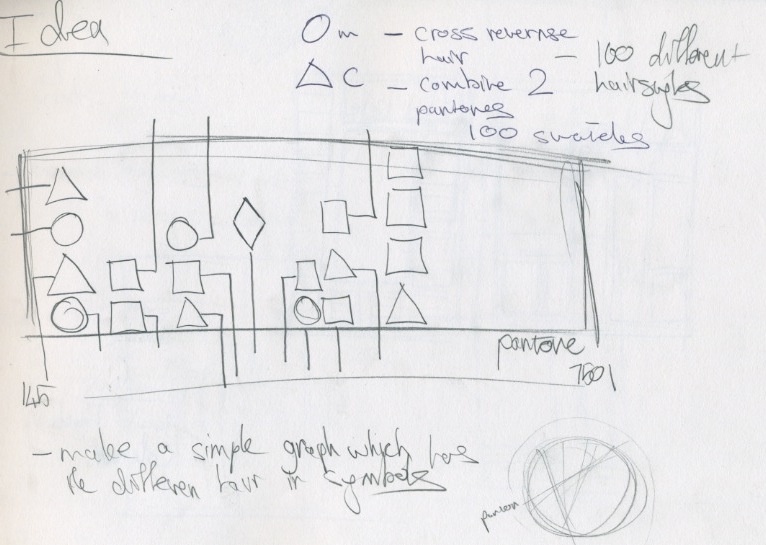
This was an idea for a much more simple graph where i would represent hair colour by symbols on a graph according to their pantone on the x axis. This idea was never produced as i couldnt find anything to measure it against on the y axis, this graph would also of been very confusing so i decided against making it in illustrator after a couple of failed attempts. The failure of this graph pushed my ideas more towards working with pie style charts as they were very simple and represented my complicated results well.

In my research i found that each person commonly had more then 1 pantone, i had the idea to represent a poster full of pie charts which would break up and show the percentage of pantone in each persons hair. Every pie chart on the poster would represent a person and there would be a 100 on the poster. This idea was also dismissed after i realised the amounts of pantones involved in colour matching a 100 people was rather vast... I also realised the colours would be very dull and it would be hard to tell the segments apart. I then realised after surveying enough people that the secondary or tertiary pantones found in hair was more of a guessing game and not accurate to read at all.

Some initial ideas for statistical graphs, these were some starting points but the changed a lot while experimenting with them on photoshop/illustrator.

more idea's of types of statistical graphs i could produce and what symbols i could use as substitutes for the colours.
No comments:
Post a Comment